...
| Table of Contents | ||||
|---|---|---|---|---|
|
General
For this exercise, you need either Pymol or Yasara installed that have has the 3DM plugin. If you don't have Yasara or Pymol or you are missing the 3DM functionality, please consult the installation instructions. Before you start this exercise make sure you have the latest version of Yasara or Pymol installed.
...
| Panel | ||||
|---|---|---|---|---|
| ||||
At the starting page of each 3DM database, you see the 3DM data cycle. The icons in the circle represent links to the most important 3DM options. These options are also available on the left. |
...
Fungi can be pathogenic to plants and animals. It is known that the secretion of oxalate by fungi is a commonly used strategy for their pathogenicity. Oxalate is toxic and can form crystals which that demolish the cell wall of the host. The oxalate is produced from oxaloacetate catalyzed by the enzyme oxaloacetate hydrolase (OAH). This is the reaction:
...
For each protein in the 3DM database, there is a "protein information" page that contains more detailed information.
...
| Expand | ||
|---|---|---|
| ||
| In the quick search (you can find box this just above the green bar in 3DM) you can use p:"G3Y473” or you can simply search for G3Y473 in the keyword search tab. |
At On the protein information pages, you can find a couple of different tabs. Have a quick look at what you can find in each tab.
...
| Expand | ||
|---|---|---|
| ||
In the keyword search tab of the search option, you can select species. Here you can type the species names. We have separately searched for each of the species and the resulting proteins were added to the subset window by clicking the + signs of the subset window. Try to search yourself for Aspergillus clavatus in the species search options. You will find two proteins (A1CFP3 and A1CMM8). These are the first two proteins of the subset. You can get a list of the proteins that are in a subset by clicking in the subset window on the number (in this case 33) that indicates how many proteins are in the subset. |
...
| Expand | ||
|---|---|---|
| ||
A subset is a mini 3DM made of only the sequences that are defined in the subset. All features and data types are re-calculated and can be compared to data in other subsets of to the whole superfamily. Here we want to find the proteins/residues responsible for oxalate production in oxalate-producing fungi. We try to find things (e.g. residues) that are specific for to the subset. |
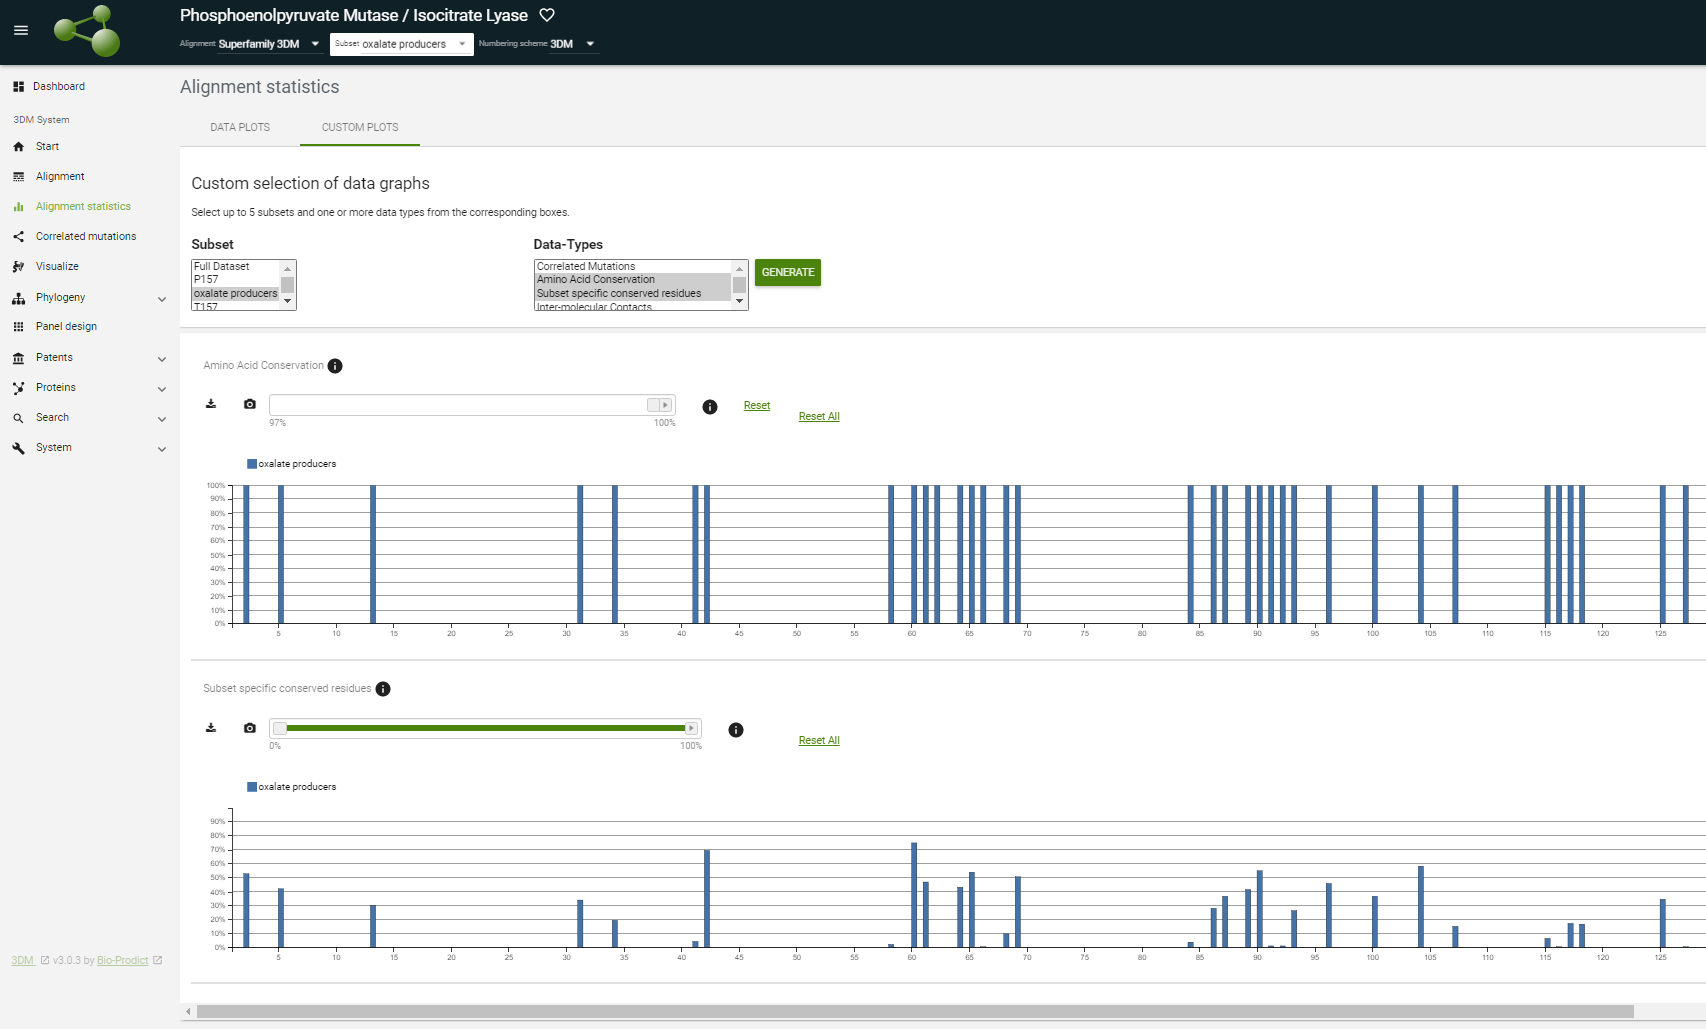
At the alignment, statistics pages change between the full dataset and the "oxalate producers" you just made using the 'Subset' menu in the header on top of 3DM and see how the graphs change.
...
Important here is to realize that these are positions that are not just simply conserved in this subset of oxalate producing fungi, but the corresponding residues are absent from the rest of the sequences in the superfamily. In other words, these residues are specific for this subset.
...
| Info | ||||
|---|---|---|---|---|
| ||||
How many positions are 100% conserved? And how many of those are specific for the oxalate-producing fungi? |
| Expand | ||
|---|---|---|
| ||
You can put the slider bar of the amino acid conservation plot on 100%. You will see that there are 47 positions 100% conserved in the oxalate producers subset (see figure).
This figure show shows what you should have selected. Here the conservation cut-off was set on at 100%. Clearly, the subset-specific conserved residues are found mainly around position 157. |
...
| Expand | ||
|---|---|---|
| ||
Difference = 98.94%. In the "subset specific conserved" plot the number is 99,38 (you can see this by putting your mouse over the peak of the subset specific conserved plot at position 157). The difference between these numbers come comes from the fact that in the full alignment the serine's of the oxalate producers subset are included. The "subset specific conserved residues" plot calculates the difference between the conservation in the subset minus the conservation of the full set but then without the sequences of the subset. |
...
| Expand | ||
|---|---|---|
| ||
The proteins in a superfamily usually form groups of different specificities. Within a group the residues important for specificity are conserved, but between the groups, they mutate. Since they all mutate simultaneously between the groups they result in a correlated mutation network. Note: which protein feature is behind a correlated mutation network heavily depends on the input alignment. If you make a subset of enzymes that all have the same specificity the correlated mutation will, of course, not reflect changes in specificity and thus the network will not be composed of specificity hotspots. The concept of how to choose the input alignment is explained in more detail later in this practical. |
...
| Expand | ||
|---|---|---|
| ||
Position 157 is the highest correlating positionsposition. Note that you can click on the heatmap. This will lead to plots showing the amino acid distribution of the two corresponding positions. Those plots show the co-occurrence of amino acids. This data can be use to see if it might be better to make certain double mutants instead of single mutants. |
...
- Select the "Correlation Networks" tab. Here you can give a keyword in the "Literature & Mutations" window on the right.
- Type " specificity" in the box. This will select mutations from the literature that effect affect specificity reported in any of the proteins of the superfamily.
...
| Expand | ||
|---|---|---|
| ||
It enables to the plot of any other data type of which the 3D number is known on the network. This is one of the strong feature features of 3DM. All data and all tools are connected via the 3D numbers. |
| Info | ||||
|---|---|---|---|---|
| ||||
Which residue positions are reported to effect affect specificity and which one is the most published position in relation to specificity? |
...
| Expand | ||
|---|---|---|
| ||
The enrichment score is the factor that shows how many more times mutations related to the keyword are found in the network compared to positions outside the network. The enrichment score for specificity in the OAH network is 7.39. This means that there are 7.39 times more mutations effecting affecting specificity published at positions in the network. Thus it is likely that specificity is the evolutionary pressure that caused the positions in the network to mutate simultaneously. Note that an enrichment score of >4 or 5 normally is significant. |
...
| Expand | ||||||||||||||
|---|---|---|---|---|---|---|---|---|---|---|---|---|---|---|
| ||||||||||||||
Position 157 scores highest when both numbers are added. Positions that both make a contact with a ligand but also show correlated mutation behaviour behavior are likely hotspots for specificity.
Some positions, like 116 make a lot of contacts with ligands , but do not show correlated mutation behaviourbehavior. Do you understand why this is? Position 116 is a conserved position. This position is important for the general function of the protein (the reaction) and not for the specific function.
|
...
3DM selected three structures as potential good templates. In this course, you will learn how to select the best template, make the best alignments, etc., but for now, we will use 3LYEA → it does have the best resolution (e.g. quality).
Select 3LYEA as a template and use the "alignment" as numbering. You can open the model either with Yasara or Pymol. Note that generated models can always be retrieved from the "visualize" pages. The third form on this page contains the models. Here you can select your model and different data that you want to visualize in your model.
- Select in yasara or pymol residue with 3D number 157.
| Info | ||||
|---|---|---|---|---|
| ||||
What is the residue type of 157? In yasara you can make a residue visible by right-clicking on the residue in the sequence at the bottom of Yasara and choose "Show Atoms → residue" |
...
Structures can be loaded directly in Yasara from the 3DM database via the 3DM → load from the 3DM option. Loading structure files via the 3DM menu ensures that the structures are all superimposed, co-crystalized crystallized compounds will have to be positioned in the active site and proteins will have the 3D numbering.
...
- To do this delete one oxygen of SO3 → select it and press delete.
- Then right-click on the S and select "swap → atom" and replace it with a carbon. The angles are not perfect (it needs energy minimization), but it gives a quick and dirty idea how oxaloacetate fits in the active site.
...
- Load the 1M1B structure
- Zoom in on the ligand, find the SO3 group
- Ctrl + Middle click on one of the Oxygen atoms on the SO3 group. A number of extra objects appears appear in the object list on the right.
- In the command line at the top, enter: remove pk1 and press enter. The oxygen atom will disappear.
- Ctrl + Middle-click on the S atom in the group.
- In the command line, enter: alter pk1,elem="C" , then press Enter
- In the command line, enter: alter pk1,name="C4" , then press Enter
- In the object list, click on the C that appears next to the 1M1B object. Select any of the coloring schemes under Color... By element. The SO3 group will now be colored the same as a CO2 group.
...
Actually, oxaloacetate in water is in equilibrium with its diol form (figure 4).
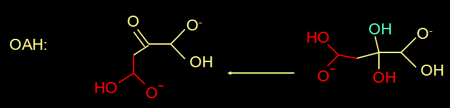
Fig 4. Oxaloacatate Oxaloacetate is in equilibrium with its diol.
...
The inhibitor was designed by organic chemists that realized they had to make a compound that is 100% in the diol form. This was the case with difluoro-oxaloaceate. This compound indeed proved to be a very strong inhibitor of OAH and was later crystalized crystallized together with OAH of the fungus Cryphonectria Parasitica (pdb file 3M0JA).
...
| Expand | ||
|---|---|---|
| ||
No, in a subset with only P on position 157 the P is, of course, 100% conserved and therefore can't mutate together with other positions. The correlated mutation data that 3DM calculates is a measure for of how often mutations occur together between two positions. No mutations will result in a score of 0. |
...
| Expand | |||||||
|---|---|---|---|---|---|---|---|
| |||||||
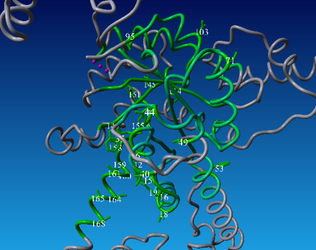
In the figure, you can see where the correlated mutation are is found in the P157 alignment. This plot was generated by clicking "visualize all notes" in CorNet when the P157 subset was selected.
From within Yasara you can also make this visualization by the following functions:
Now to answer the question do the following:
You can switch between the two scenes using the different tabs. Clearly, the two scenes overlap. So the correlated mutations in the P157 alignment are formed during evolution in the dimerization domain.
|
...
The correlated mutations in this superfamily seem to reflect positions important for specificity. You want to change the specificity of OAH and you decide to rationally design a mutant library. Your screening method allows you to screen up to a 1000 mutant clones.
| Info | ||||
|---|---|---|---|---|
| ||||
How would you design your library? (Just give a general description of which residue positions you would choose, why you choose those and which residues you would try at those positions) |
...
| Expand | ||
|---|---|---|
| ||
This question can be answered thoroughly or just very simple. One thing is for sure, everything shows that the correlated mutations are important for specificity. Those are your first-choice hotspots. Then pick as many positions as your screen allows only using common residues at these hotspots (e.g. residues > 2% or so). This cufcut-off percentage is depending on how many hotspots you want to use. The more hotpots the higher this percentage or your library size gets too big. So it is always a trade-off between the number of hotspots and the number of residues per hotspot. There are many things to consider when you choose hotspots and the residues at the hotspots. Each position should be considered carefully and all data at each position should be investigated. These are things to consider:
|
...