The basic steps to use the "visualize data in structure module" are:
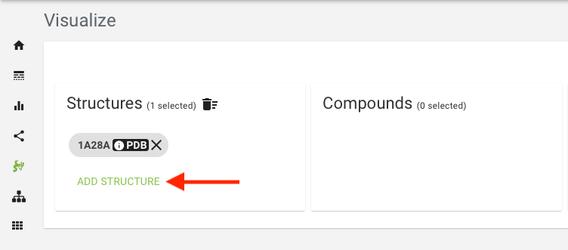
- Select one or more structure files from the "select structure" tabStructures" table by clicking "Add structure" button. (The "System default template" is by default selected. Users can change this by clicking the settings icon.)
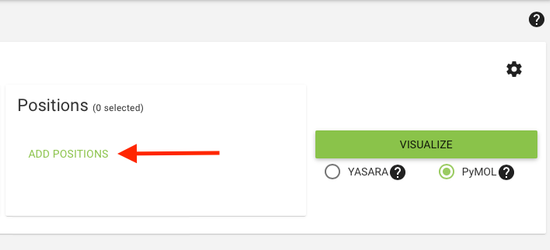
2. Select or deselect position data (custom, hotspot, correlated mutations, conservation,
...
etc) that will be visualized in the selected structures
...
In the first tab (select structures) different available by clicking the "Add positions" button.
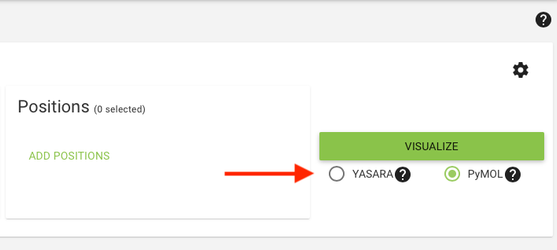
3. Users can select their preferred visualization tool by clicking the YASARA / PyMol radio buttons. Download the visualization file by clicking the "Visualize" button.
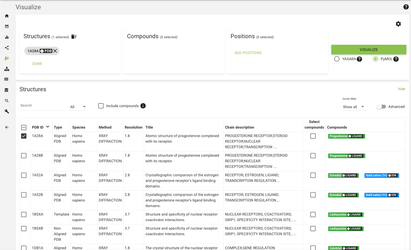
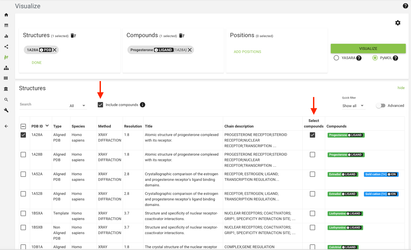
In the structures table different structures can be selected. ALL STRUCTURES CAN BE COMBINED because all structures are superimposed INCLUDING the co-crystalized compound (e.g inhibitors, substrate analogs, etc).
Structures types are as followed:
- Templates: contains the structures that are the The templates of the alignmentalignments.
- PDB files in alignment: contains structure files that are PDB structures aligned in one of the subfamilies.
- Non-aligned pdb files: contains structure files that PDB structures that could be superimposed, but were not included in the alignment.*
- Models: contains structure files for any models Models that have been generated.**
- Organic ligands: contains co-crystalized small organic molecules such as inhibitors, activators, substrate analogs, etc.
- Metal/Ion/Solvent Molecules" Contains solvent molecules such as SO4, glycerol or single atoms (Ions metals).
In the other tabs "correlated mutations", "conservation" and "contacts" different data types can be selected that, after enabling the checkboxes, will be visualized in the structure(s) that are selected in the "select structures" tabs. Note that the correlated mutation data and the conserved residues are selected by default.\Structure compounds can also be included by clicking on the "Include compounds" checkmark next to the search box or be manually selected/deselected under the "Select compounds" table column.
* Why 3DM did not include PDB files in the alignment can have multiple reasons, but mostly this is because the structural similarity is low compared to the other family members.
** To generate models, go to the protein page of the sequence for which a model needs to be generated and click "generate model".